Vitest UI
Vitest 由 Vite 提供能力,在运行测试时有一个开发服务器。这允许 Vitest 提供一个漂亮的 UI 界面来查看并与测试交互。Vitest 的 UI 界面是可选的,你可以通过以下安装:
npm i -D @vitest/ui接下来,你可以通过传入 --ui 参数来启动测试的 UI 界面:
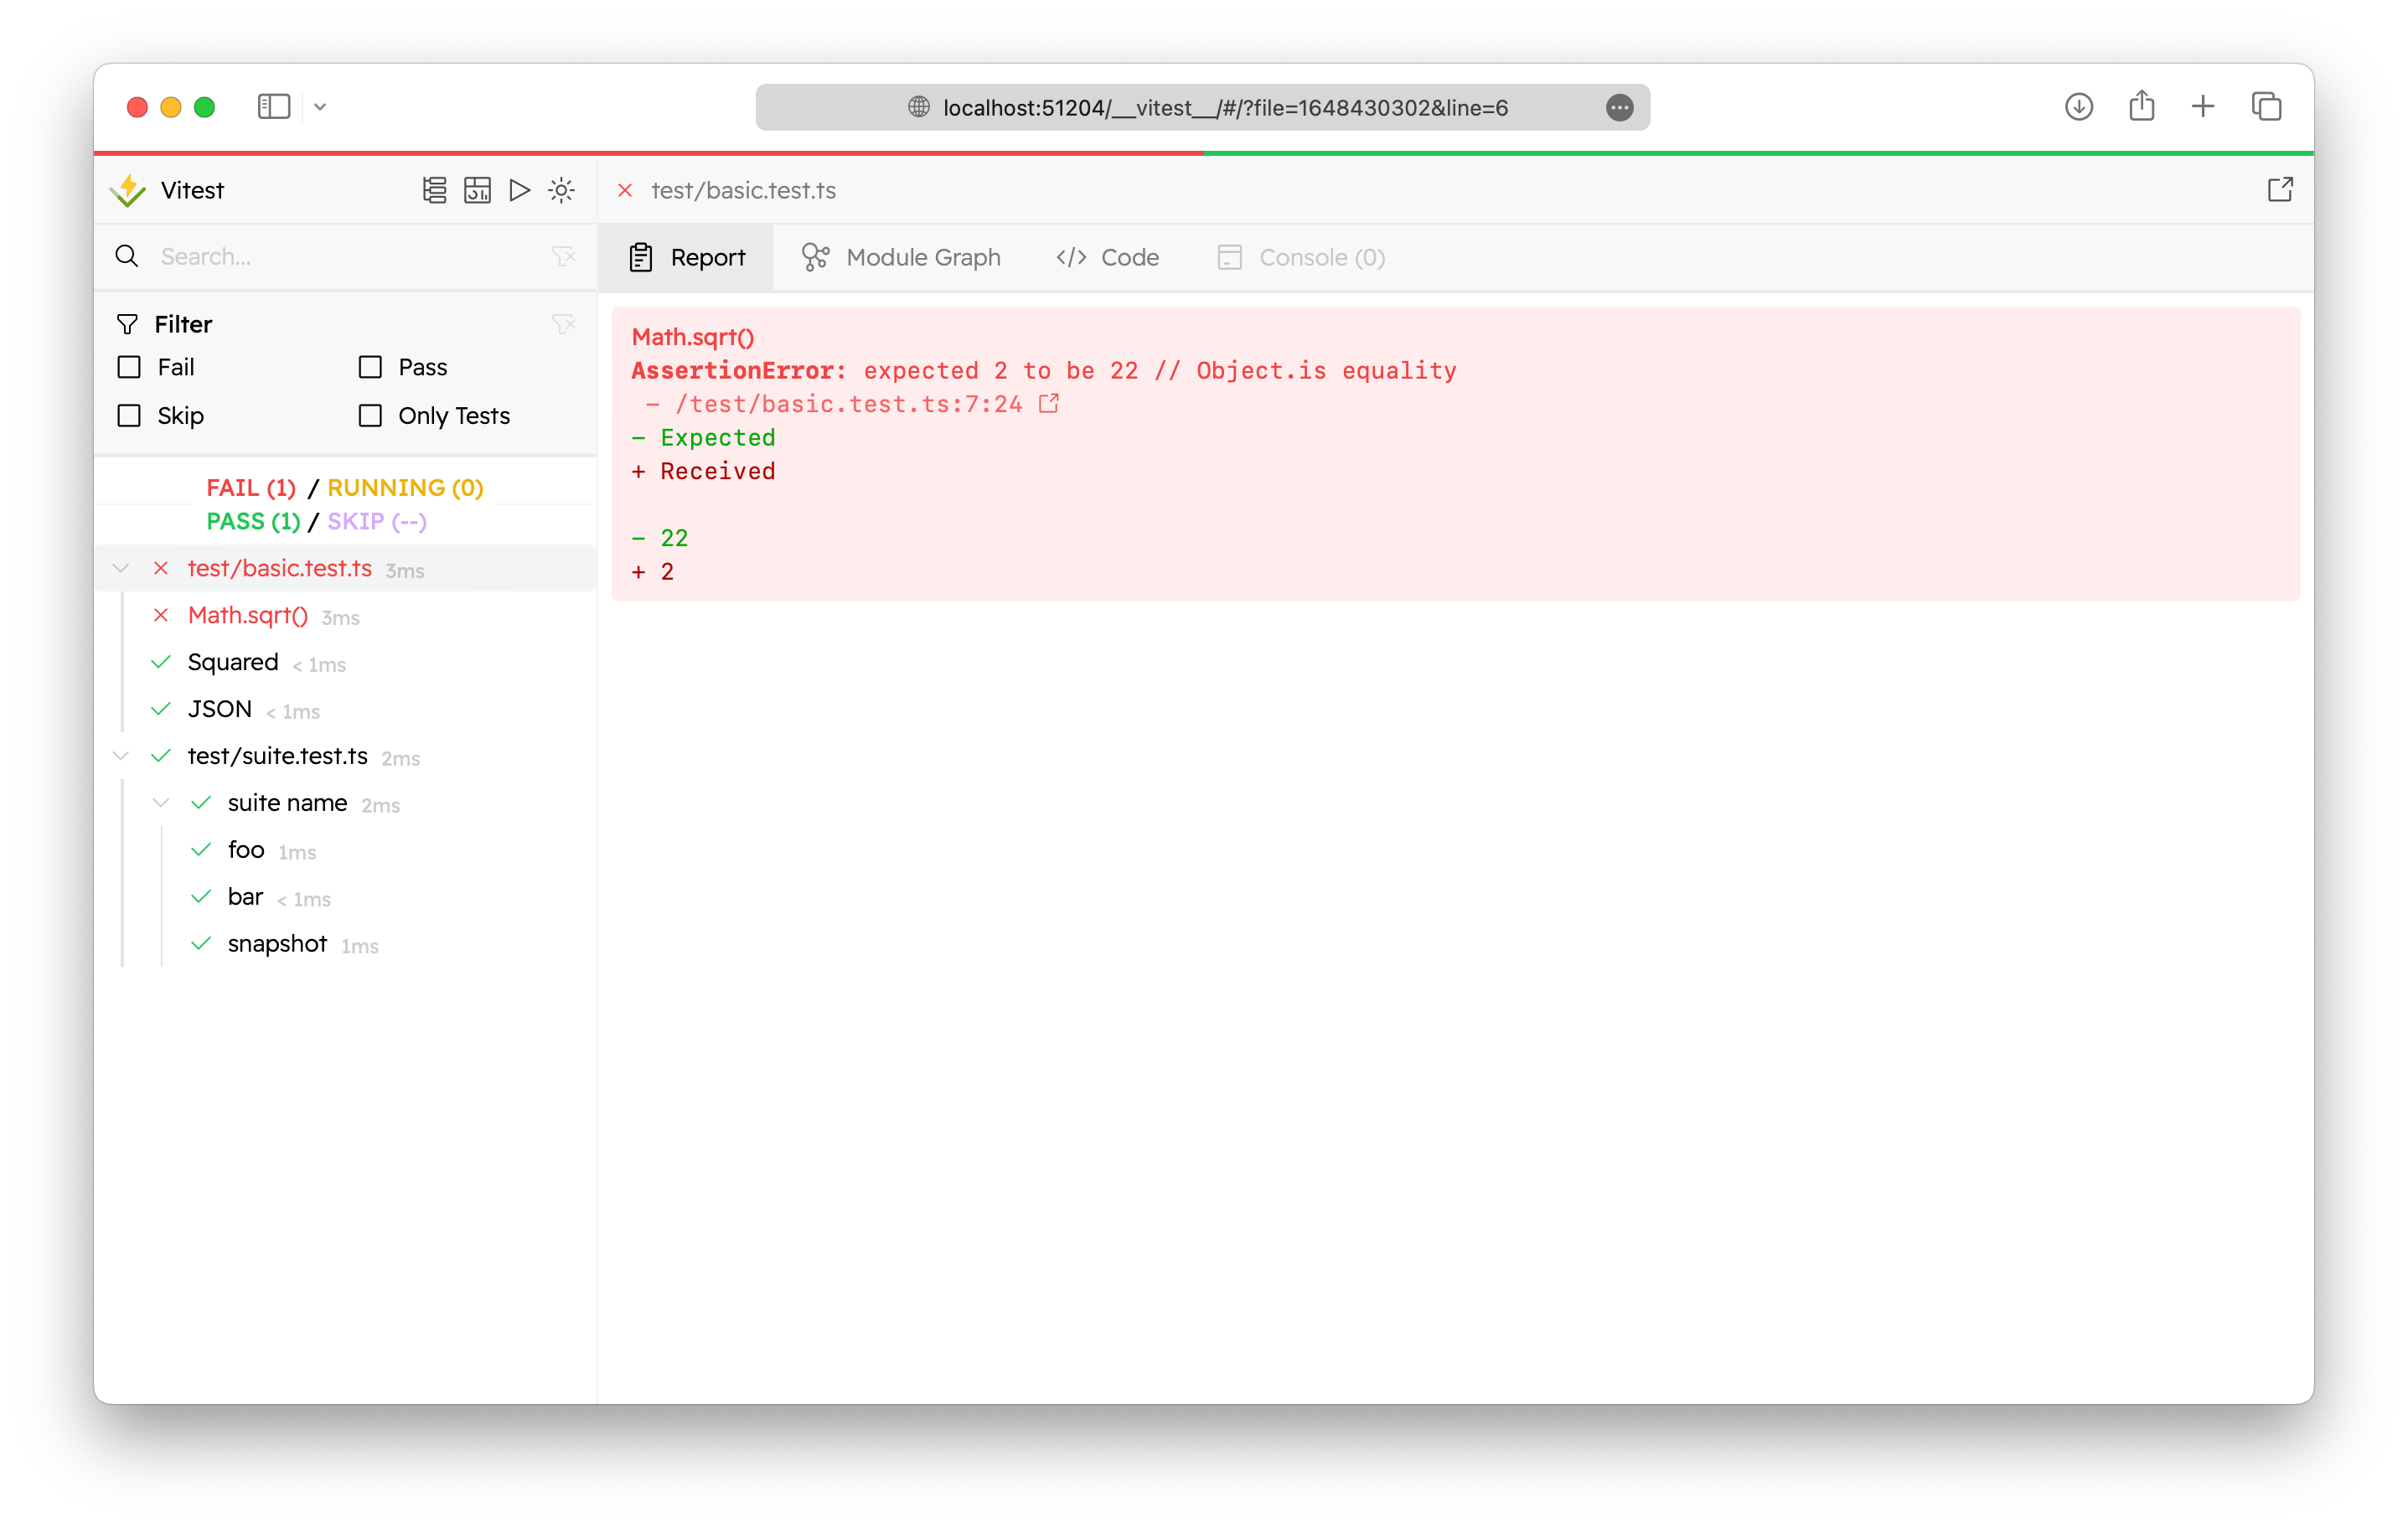
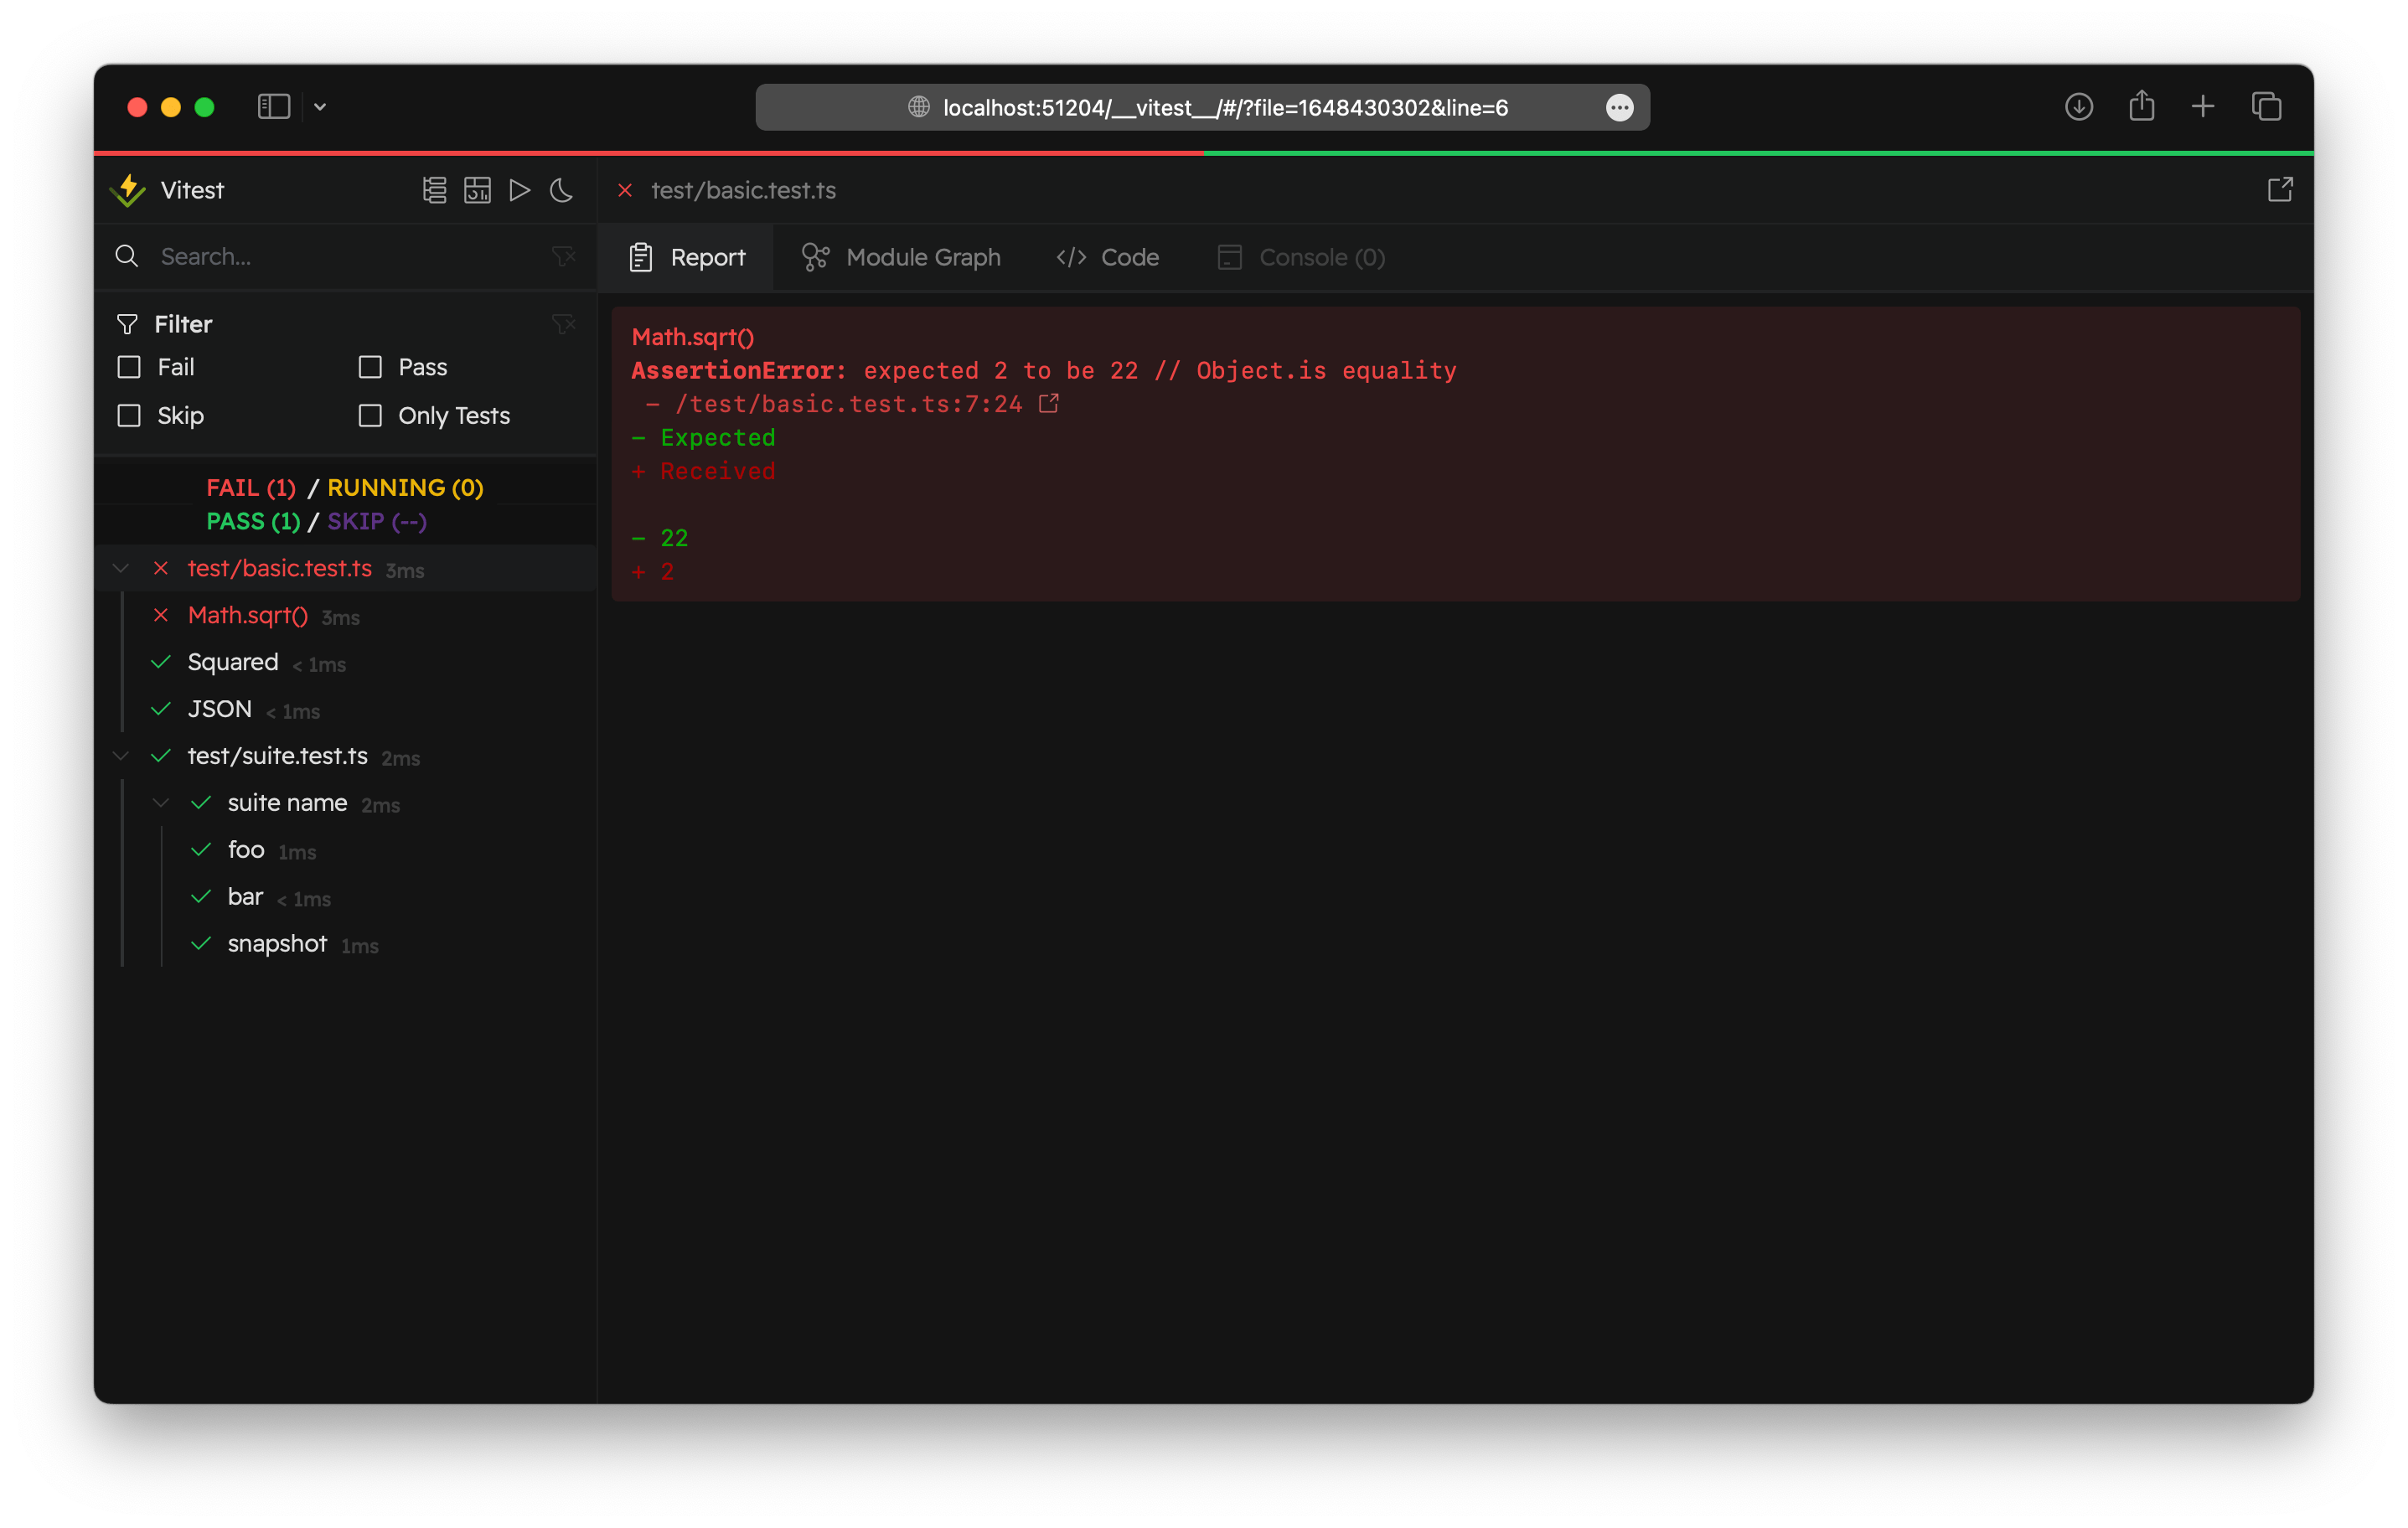
vitest --ui最后,你可以访问 Vitest UI 界面,通过 http://localhost:51204/__vitest__/
WARNING
UI 是交互式的,需要一个正在运行的 Vite 服务器,因此请确保在 watch 模式(默认模式)下运行 Vitest。或者,你可以通过在配置的 reporters 选项中指定 html 来生成一个与 Vitest UI 完全相同的静态 HTML 报告。
UI 也可以用作测试报告器。 在 Vitest 配置中使用 'html' 报告器生成 HTML 输出并预览测试结果:
import { defineConfig } from 'vitest/config'

export default defineConfig({
  test: {
    reporters: ['html'],
  },
})
你可以在 Vitest UI 中查看覆盖率报告:查看 覆盖率 | UI 模式 了解更多详情。
WARNING
如果你仍想在终端中实时查看测试的运行情况,请不要忘记将 default 报告器添加到 reporters 选项:['default', 'html']。
TIP
要预览你的 HTML 报告,可以使用 vite preview 命令:
npx vite preview --outDir ./html你可以使用 outputFile 配置选项配置输出。你需要在那里指定 .html 路径。例如,./html/index.html 是默认值。
Module Graph
Module Graph's tab displays the module graph of the selected test file.
INFO
All of the provided images use Zammad repository as an example.
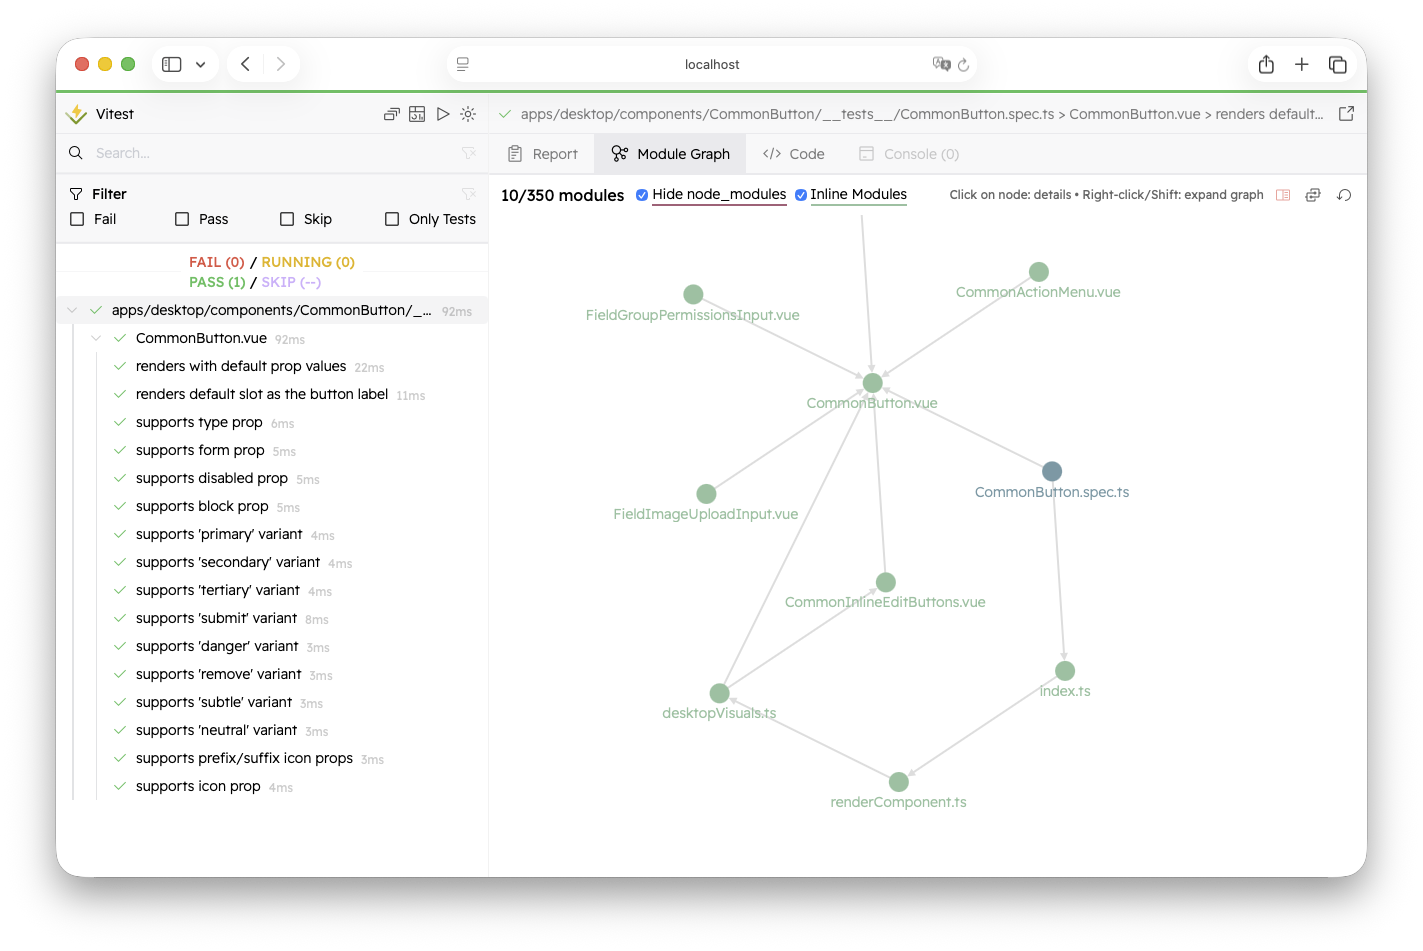

If there are more than 50 modules, the module graph displays only the first two levels of the graph to reduce the visual clutter. You can always click on "Show Full Graph" icon to preview the full graph.
WARNING
Note that if your graph is too big, it may take some time before the node positions are stabilized.
You can always restore the entry module graph by clicking on "Reset". To expand the module graph, right-click or hold Shift while clicking the node that interests you. It will display all nodes related to the selected one.
By default, Vitest doesn't show the modules from node_modules. Usually, these modules are externalized. You can enable them by deselecting "Hide node_modules".
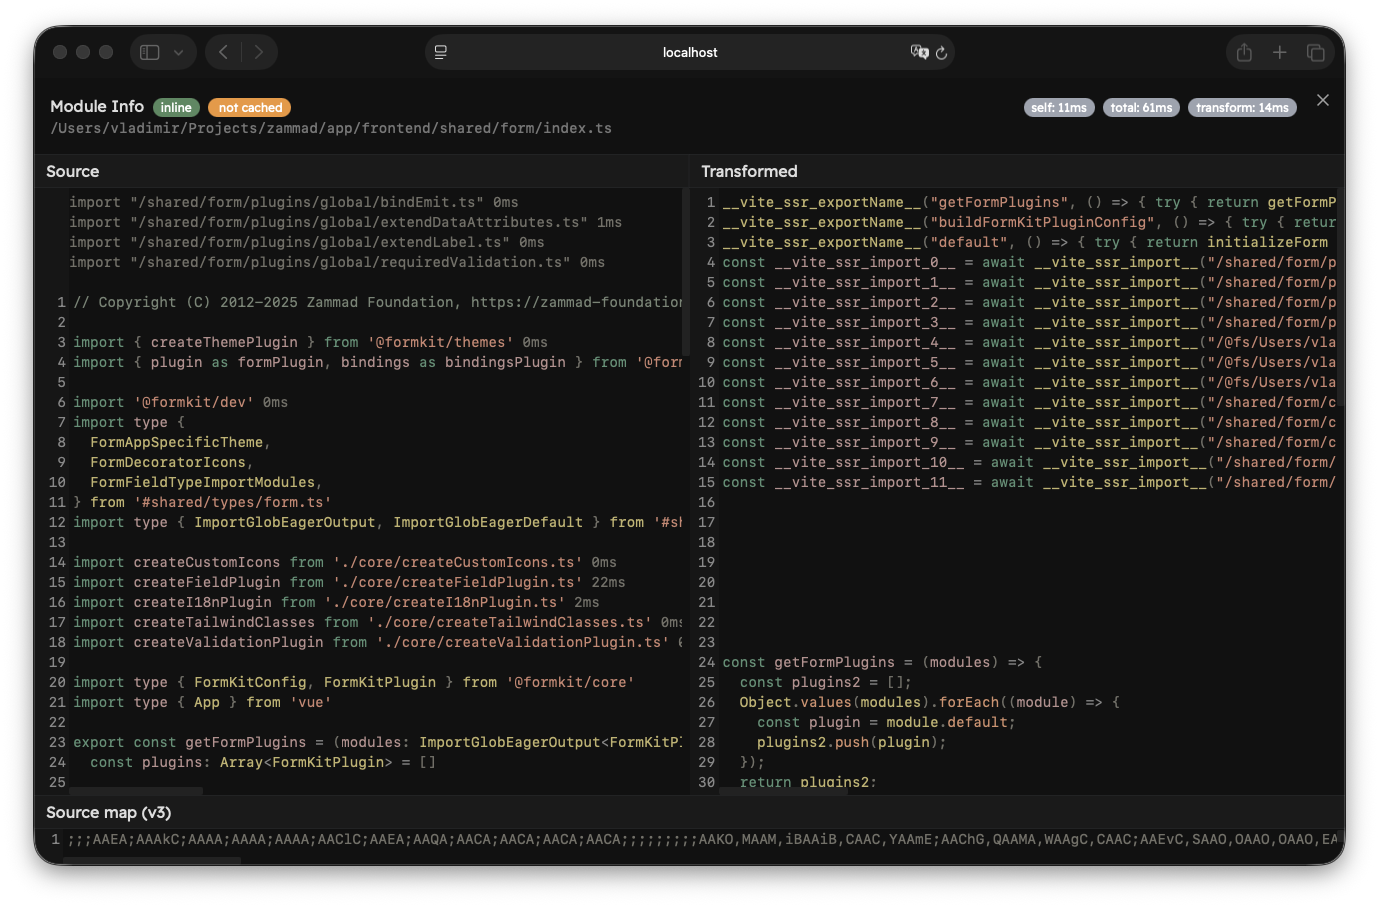
Module Info
By left-clicking on the module node, you open the Module Info view.

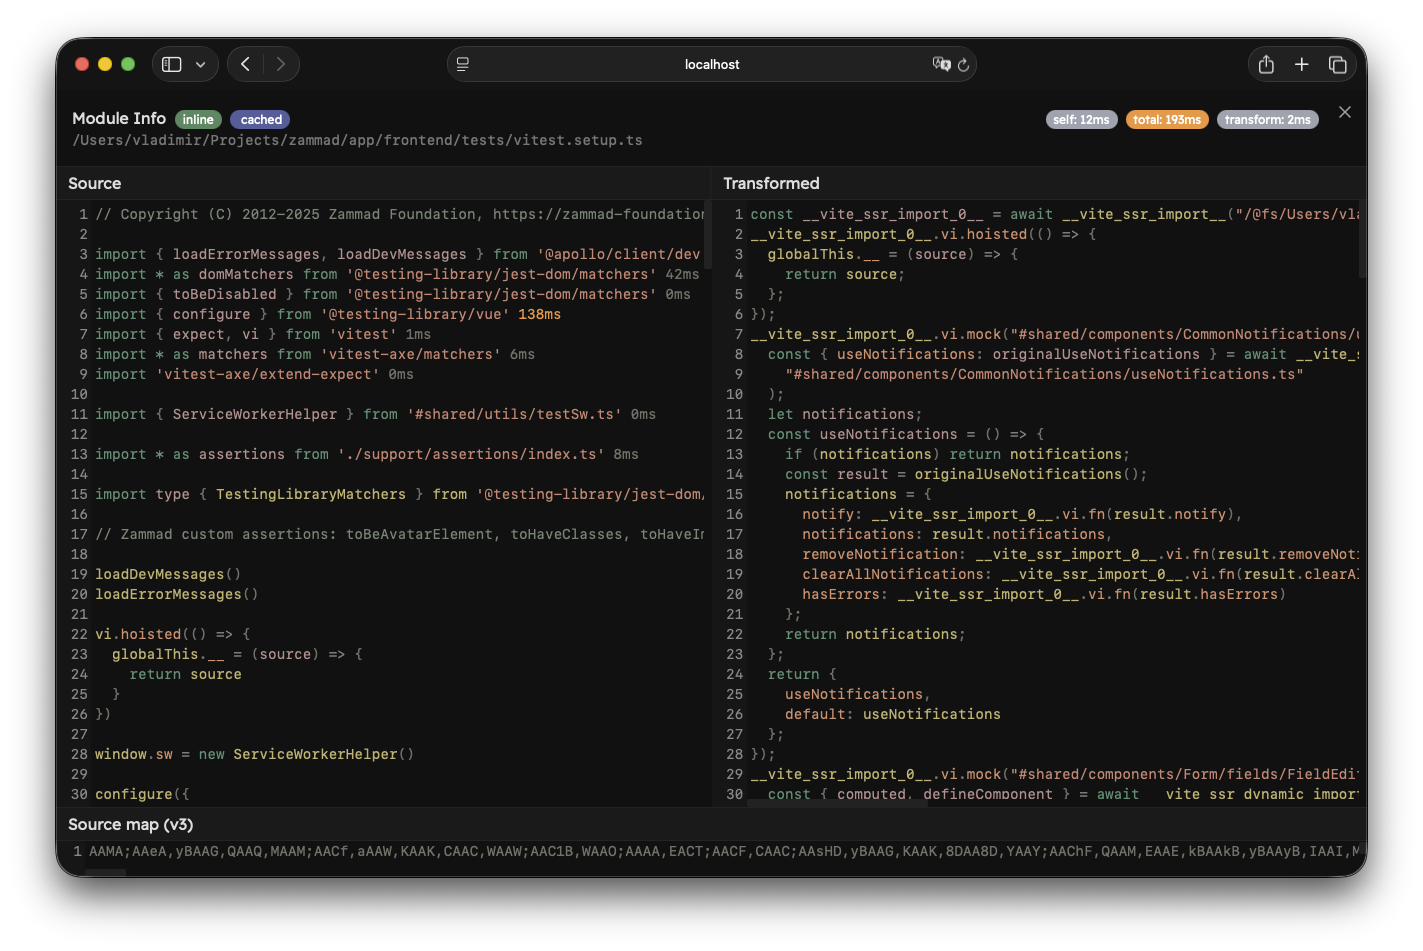
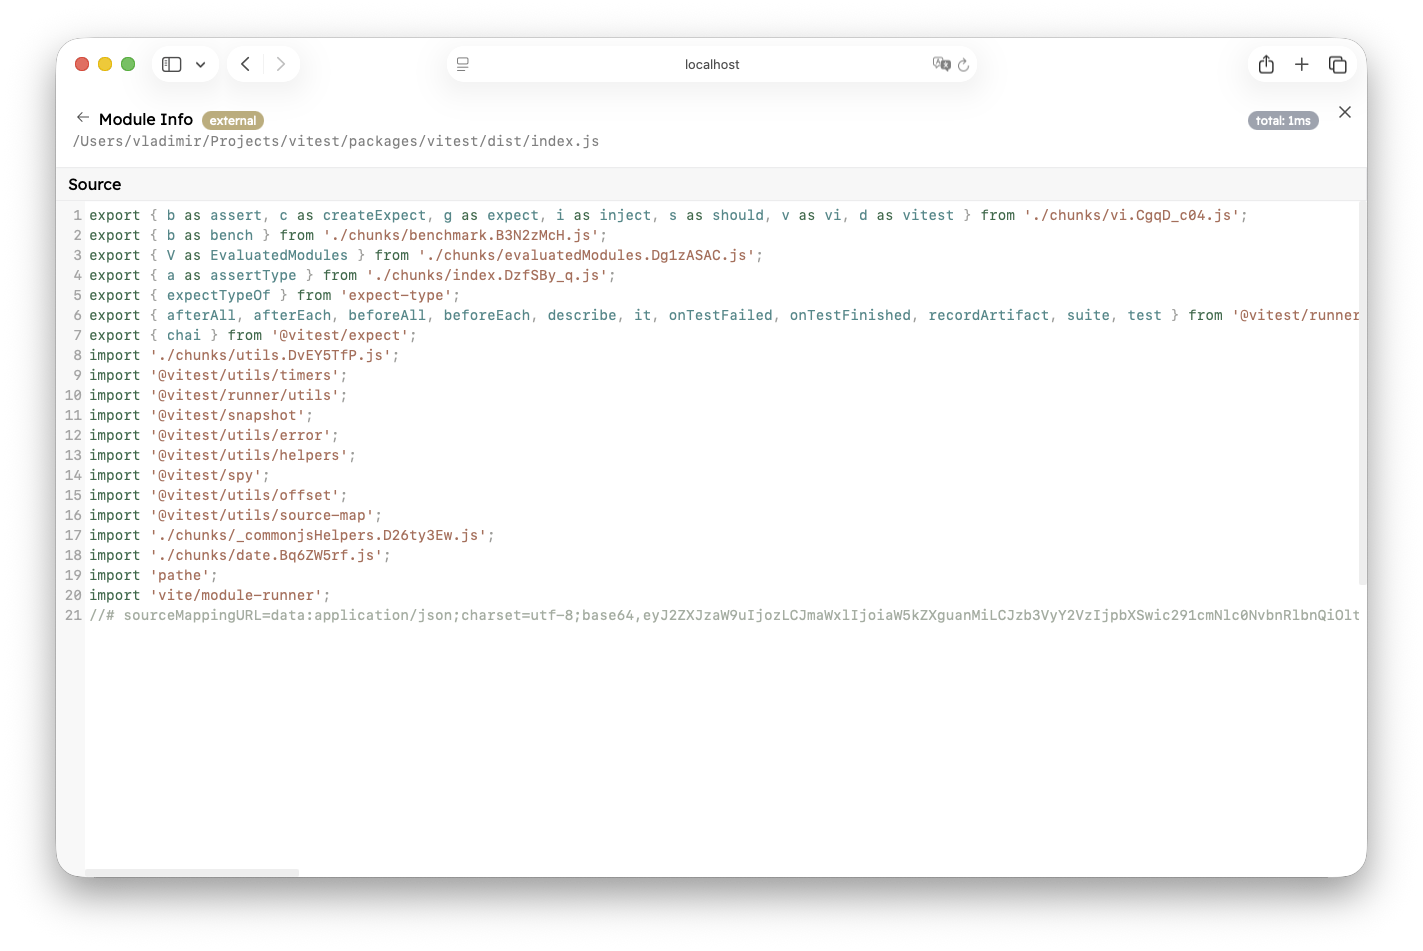
This view is separated into two parts. The top part shows the full module ID and some diagnostics about the module. If experimental.fsModuleCache is enabled, there will be a "cached" or "not cached" badge. On the right you can see time diagnostics:
- Self Time: the time it took to import the module, excluding static imports.
- Total Time: the time it took to import the module, including static imports. Note that this does not include
transformtime of the current module. - Transform: the time it took to transform the module.
If you opened this view by clicking on an import, you will also see a "Back" button at the start that will take you to the previous module.
The bottom part depends on the module type. If the module is external, you will only see the source code of that file. You will not be able to traverse the module graph any further, and you won't see how long it took to import static imports.

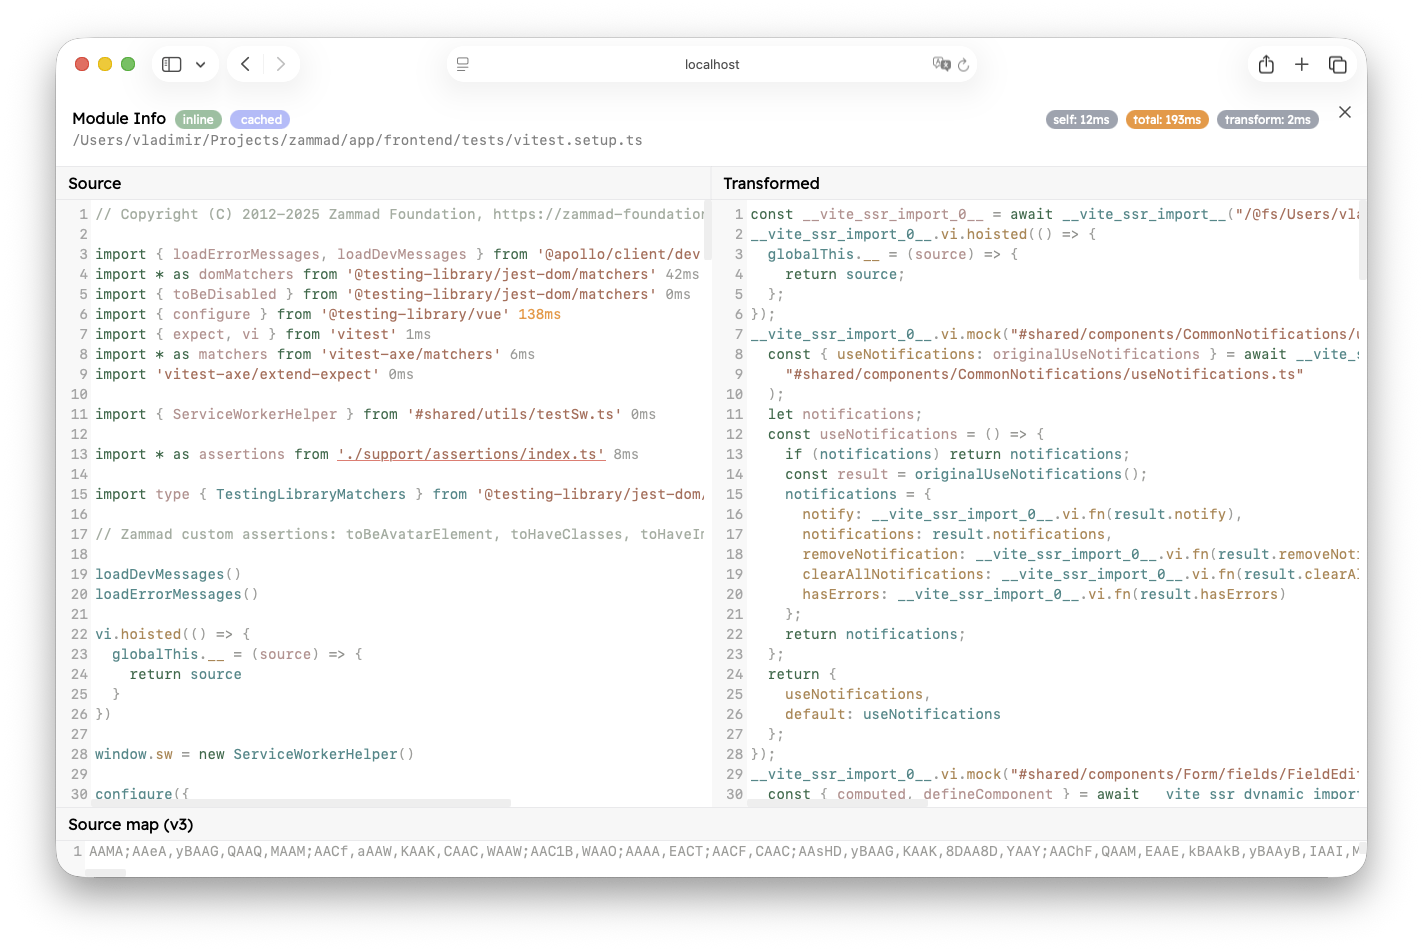
If the module was inlined, you will see three more windows:
- Source: unchanged source code of the module
- Transformed: the transformed code that Vitest executes using Vite's module runner
- Source Map (v3): source map mappings
All static imports in the "Source" window show a total time it took to evaluate them by the current module. If the import was already evaluated in the module graph, it will show 0ms because it is cached by that point.
If the module took longer than 500 milliseconds to load, the time will be displayed in red. If the module took longer than 100 milliseconds, the time will be displayed in orange.
You can click on an import source to jump into that module and traverse the graph further (note ./support/assertions/index.ts below).
WARNING
Note that type-only imports are not executed at runtime and do not display a total duration. They also cannot be opened.
If another plugin injects a module import during transformation, those imports will be displayed at the start of the module in gray colour (for example, modules injected by import.meta.glob). They also show the total time and can be traversed further.
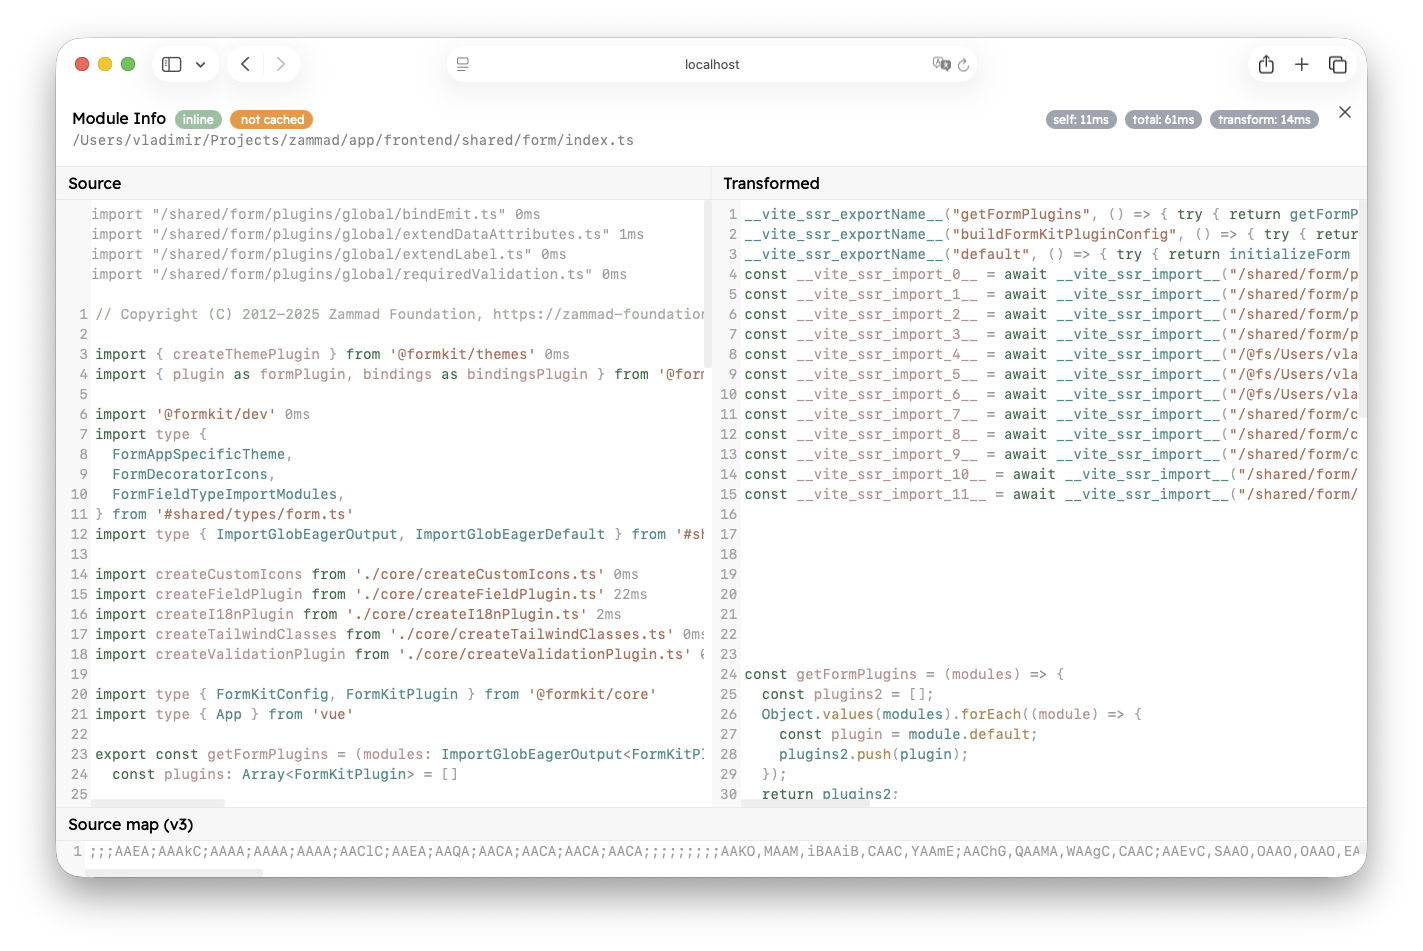
TIP
If you are developing a custom integration on top of Vitest, you can use vitest.experimental_getSourceModuleDiagnostic to retrieve this information.
Import Breakdown
The Module Graph tab also provides an Import Breakdown with a list of modules that take the longest time to load (top 10 by default, but you can press "Show more" to load 10 more), sorted by Total Time.
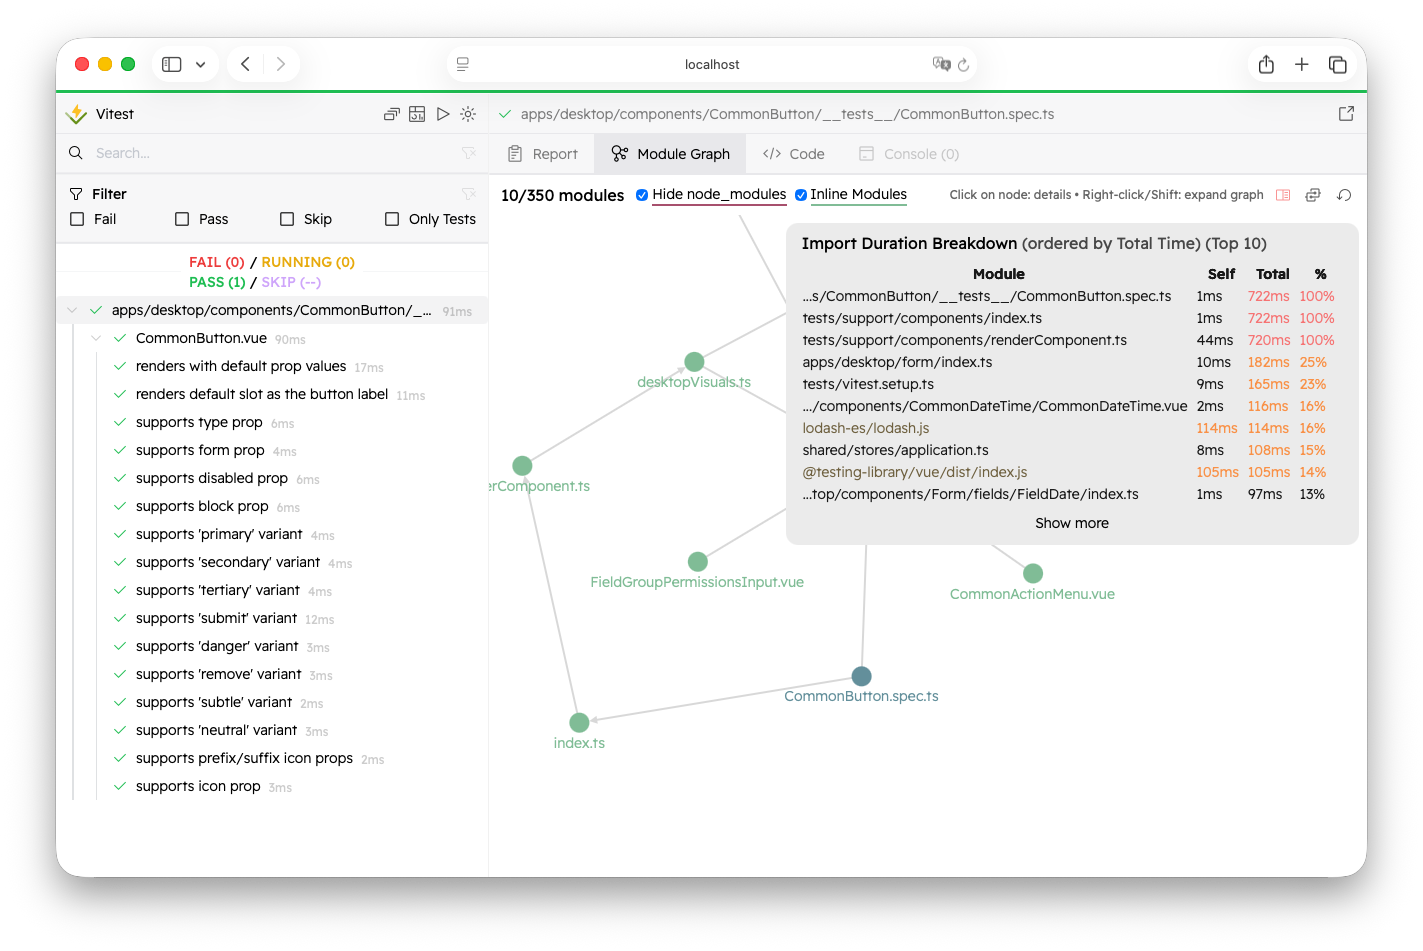
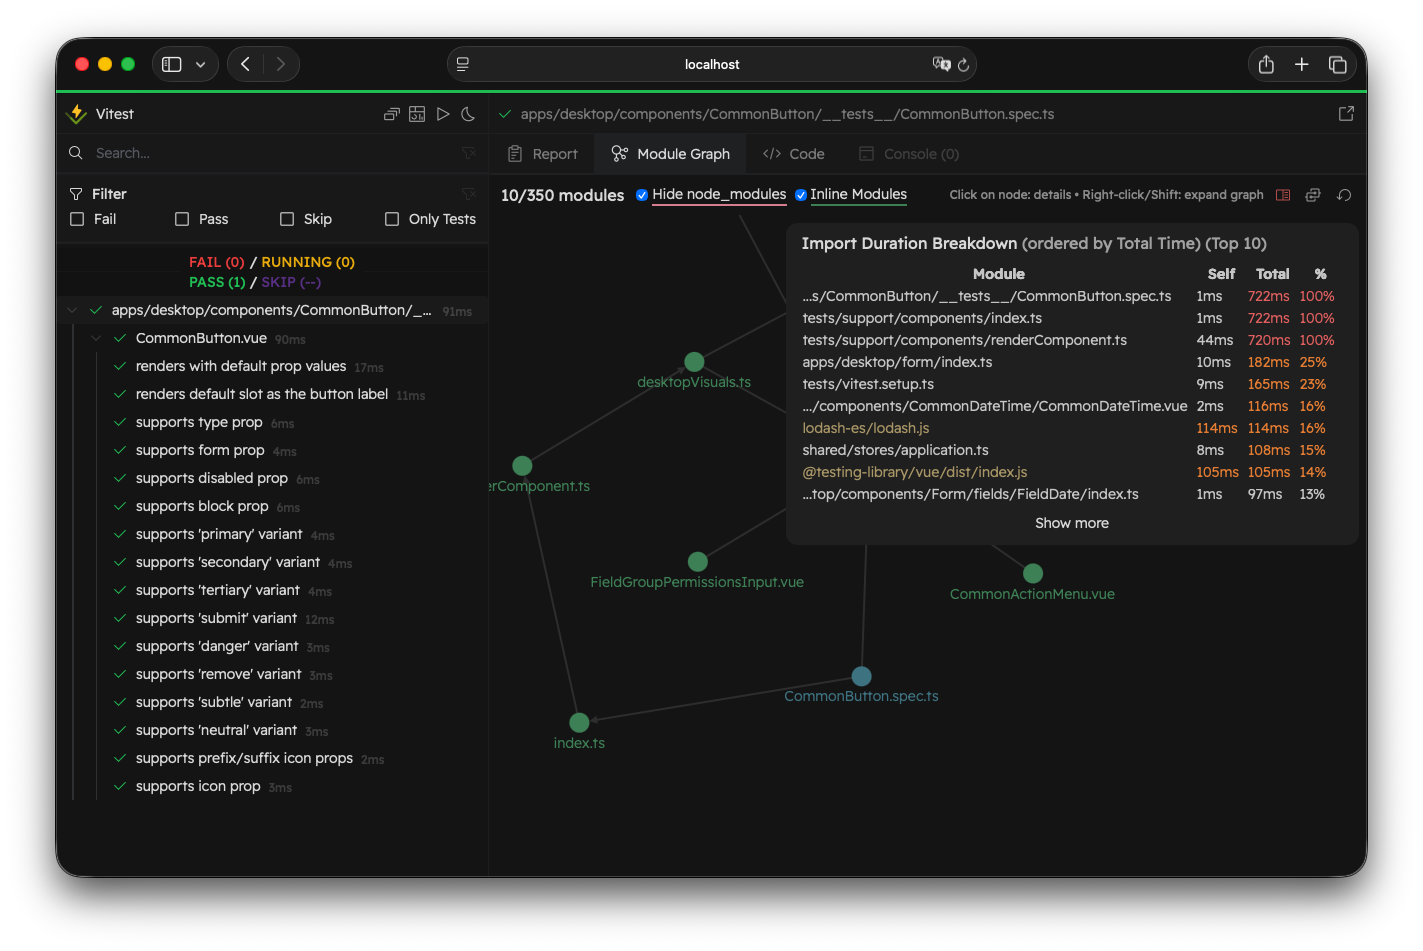
You can click on the module to see the Module Info. If the module is external, it will have the yellow color (the same color in the module graph).
The breakdown shows a list of modules with self time, total time, and a percentage relative to the time it took to load the whole test file.
The "Show Import Breakdown" icon will have a red color if there is at least one file that took longer than 500 milliseconds to load, and it will be orange if there is at least one file that took longer than 100 milliseconds.
By default, Vitest shows the breakdown automatically if there is at least one module that took longer than 500 milliseconds to load. You can control the behaviour by setting the experimental.printImportBreakdown option.